Pretty matplotlib pgf figures in Latex documents
Published:
In my experience adding matplotlib figures into Latex documents is not trivial
at all, unless you are satisfied with a simple non-vector png. I will try to
explain here how to export a figure into pgf, and how to include that in
your tex file later. The usual disclamer is valid here: it works on my
machine and I can’t guarantee that it will work on yours. As of now, I am using
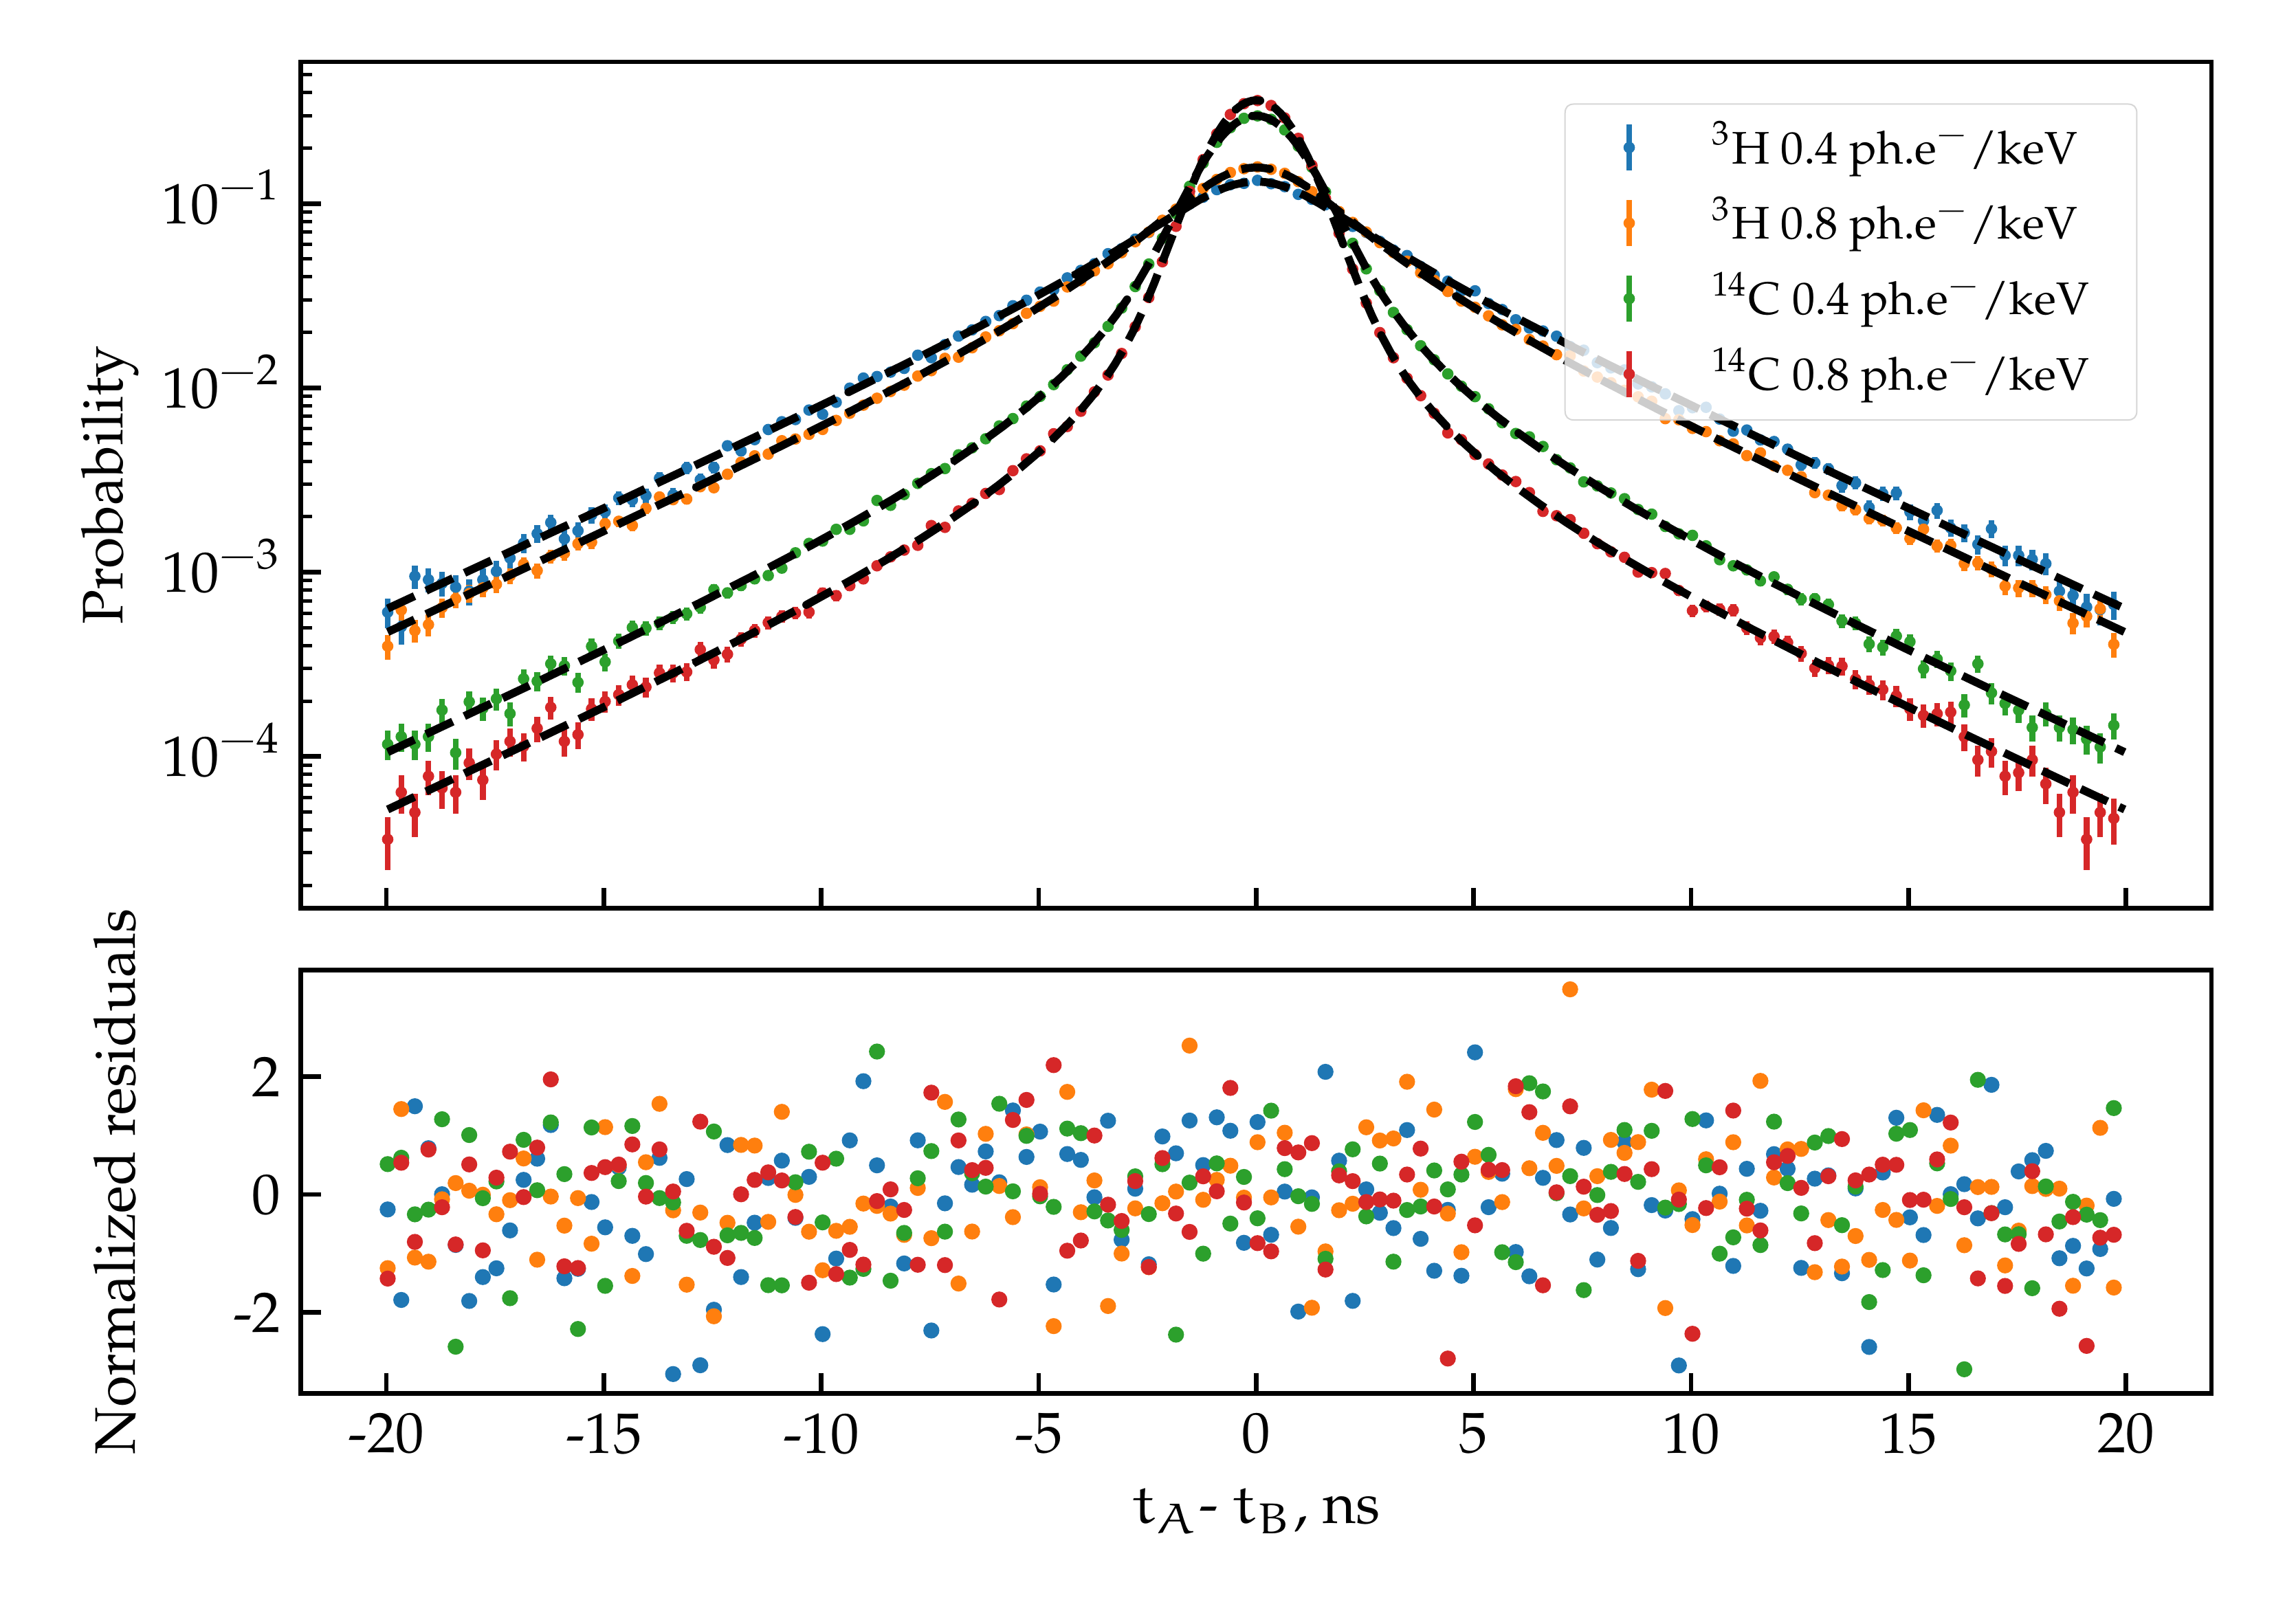
python 3.9 and matplotlib 3.4. After the tutorial you can expect some
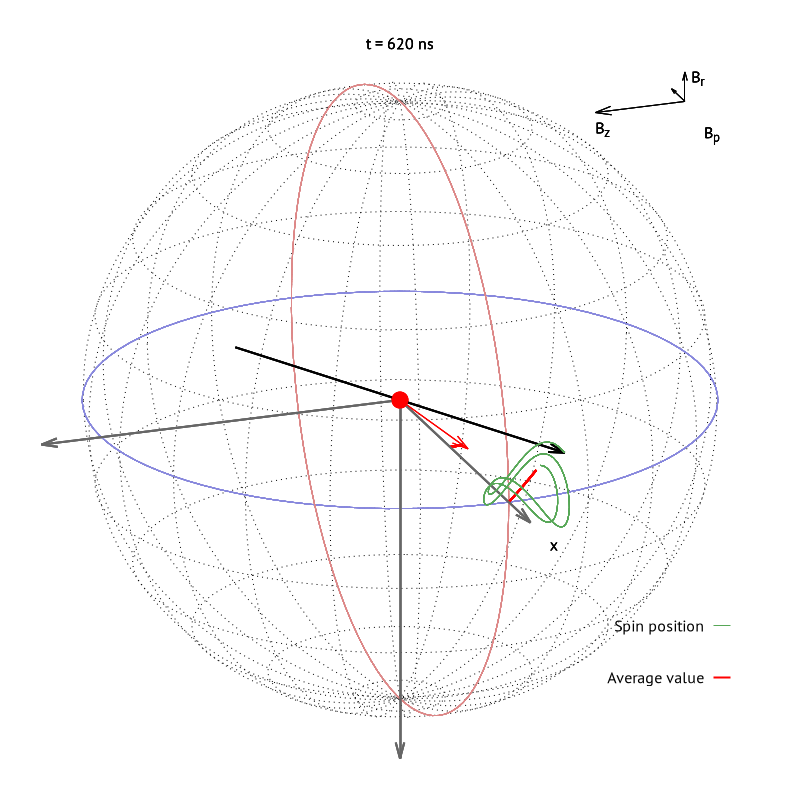
result as the one shown in the figure below.
So, first, to generate the pgf figure, you would need to make the following imports:
import matplotlib.pyplot as plt
import matplotlib
from matplotlib import rc
Then you would need to get the figure object, fig in the here shown example.
In order to use the same font as your document you would need to change some
rc parameters. Also, by default matplotlib uses a unicode minus sign, which
cannot be read by LaTeX, and you shoul disable that.
fig = plt.gcf()
matplotlib.rcParams.update({
    "pgf.texsystem": "pdflatex",
    'font.family': 'serif',
    'text.usetex': True,
    'pgf.rcfonts': False,
    'axes.unicode_minus': False,
})
fig.set_size_inches(w=6, h=4.5)
plt.style.use('seaborn-paper')
plt.style.context('seaborn-paper')
plt.tight_layout()
Here I set the style to seaborn-paper, because I like it, but you can find a
full list of styles here. I would also advise to use a tight layout to minimize the white space around your figure. Finally you can save your figure somewhere with:
plt.savefig(my_figure.pgf)
You would think that everything is OK now, but sadly you would be wrong. There
are a couple of thing that need to be set up in Latex also in order to
successfully improt the picture. First of all, import the pgfplots package.
Because building the pgfs every time you build the document is very
computationally expensive, I advise you to use the awesome pgfcache package.
One drawback of the last approach is that you would need to remake every figure
into a standalone tex file (done automatically), so you must set some kind of a
preamble to use the same fonts and style in the pgfs as your main document. To
do that add this to your preamble:
\usepackage{pgfplots}

\usepackage{pgfcache}
\setpgfpreamble{
	\renewcommand\sffamily{}
	\usepackage{mathpazo}
	\usepackage{eulervm}
}
The documentation and code of the awesome pgfcache package can be found
here. In my case I added mathpazo
and eulervm as I used the Palatino text font and Euler math font. Matplotlib
likes to impose its fonts, so to use yours you need to replace sffamily with
an empty command using renewcommand.
It is not over yet! In the main folder of your document add a folder named
_pgfcache, for example. The name of the folder can be controlled from pgfcache.sty on the following line:
\edef\@figdir{_pgfcache}
This will hold all cached figures so that they don’t bother you. Now, to add a figure into your tex file do this:
\begin{figure}
	\centering
	\renewcommand\sffamily{}
	\importpgf{figures}{my_figure.pgf}
	\caption{My caption}
	\label{fig:my_fig}
\end{figure}
Notice that my_figure.pgf is located in the subfolder figures which is below
my main folder. The whole structure is like this:
latex_project
|   main.tex
|   main.pdf
|   pgfcache.sty
|   ...
|
└───figures
|   |   my_figure.pgf
|   |   my_other_figure.pgf
|   |   ...
|
└───_pgfcache
    |   main-1.tex
    |   main-1.aux
    |   main-1.log
    |   main-1.pdf
    |   ...
In the pgfs/*.log you can find the build log for each figure, so you can see
if there are any errors. Also, if you edit my_figure.pgf, the cache will be
recompiled automatically. One common problem is that matplotlib likes to
put some points or objects at strange coordinates, so latex complains that
point x,y is outside of the page area. To fix this, simply open the
generated pgf and remove all lines that have the x,y coordinates that bother
your build process. This seems to have been fixed in the latest matplotlib
version.
Finally you should compile main.tex using pdflatex with the -shell-escape
option:
pdflatex -shell-escape main.tex
It is possible that you get an empty figure with the following error in the log:
! Dimension too large.
<to be read again>
                   \relax
l.717 ...{\pgfqpoint{-551.181102in}{393.700787in}}
                                                  %
I can't work with sizes bigger than about 19 feet.
Continue and I'll use the largest value I can.
What you need to do is to go to the corresponding pgf and delete all lines
containing this dimensions. For example search for -551 and delete all lines
containing it. This should do the trick.
The only thing that I am not happy with is the fact that matplotlib does not
used math mode $ $ to show the tick labels. As you can see they are a
different font than my main math font, but what can you do.
Well that’s it! Easy as 1 2 3 … 95858949. LaTeX + matplotlib. Not even once.